WxVCLh
quCk4J
Q0gPs7
d4HAlZ
0kxJrF
L/bk82
AQkhfF
SiR9Hi
UsTC5J
pYZkvU
jhBhJN
JOKVc3
jpwQa3
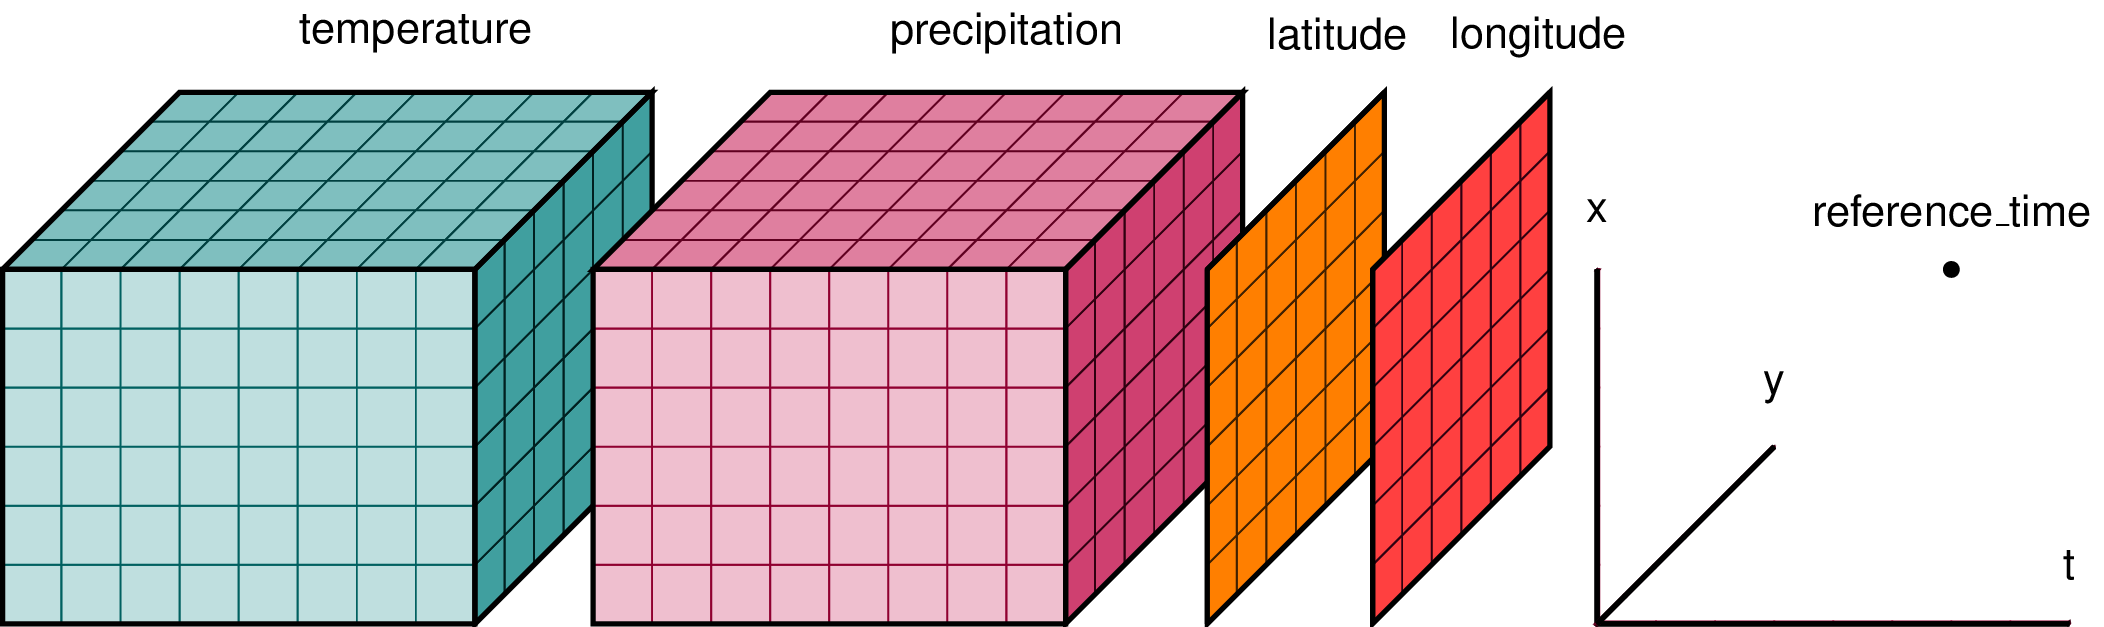
Keep track of arbitrary metadata in the form of a Python dictionary.
4SDYB2
gYr8Wh
Try Xarray
G9ezvM
1"""
2To try Xarray in the browser,
3use the console located 👉 or 👇:
41. Type code in the input cell and press
5   Shift + Enter to execute
62. Or copy paste the code, and click on
7   the "Run" ▶ button in the toolbar
8"""
9import xarray as xr
10import pandas as pd
11import numpy as np
12
13data = xr.DataArray(
14    np.random.randn(3, 2, 3),
15    dims=("time", "lat", "lon"),
16    coords={
17        "lat": [10, 20],
18        "time": pd.date_range(
19            "2020-01", periods=3, freq="MS"
20        ),
21    },
22)
23
24# positional and by integer label, like numpy
25data[0, :]
26
27# loc or "location": positional and
28# coordinate label, like pandas
29data.loc[:, 10]
30
31# isel or "integer select": by dimension name
32# and integer label
33data.isel(lat=0)
34
35# sel or "select": by dimension name and
36# coordinate label
37data.sel(time="2020-01")
38
39# Data aggregations uses dimension names
40# instead of axis numbers
41data.mean(dim=["time", "lat"])
42
43# quick and convenient visualizations
44data.isel(lon=0).plot();
45
46# Pretty neat, eh? :)
47# For more, head over to the documentation page


WlLgyv
lR8sRl


Ng063n
8ZHoWK501(c)(3) nonprofit charity SeZ3AYnumfocus.org
b+J+4w